When we say that MedBen Analytics offers interactive charts and graphs, what exactly does that mean? Several things, actually.
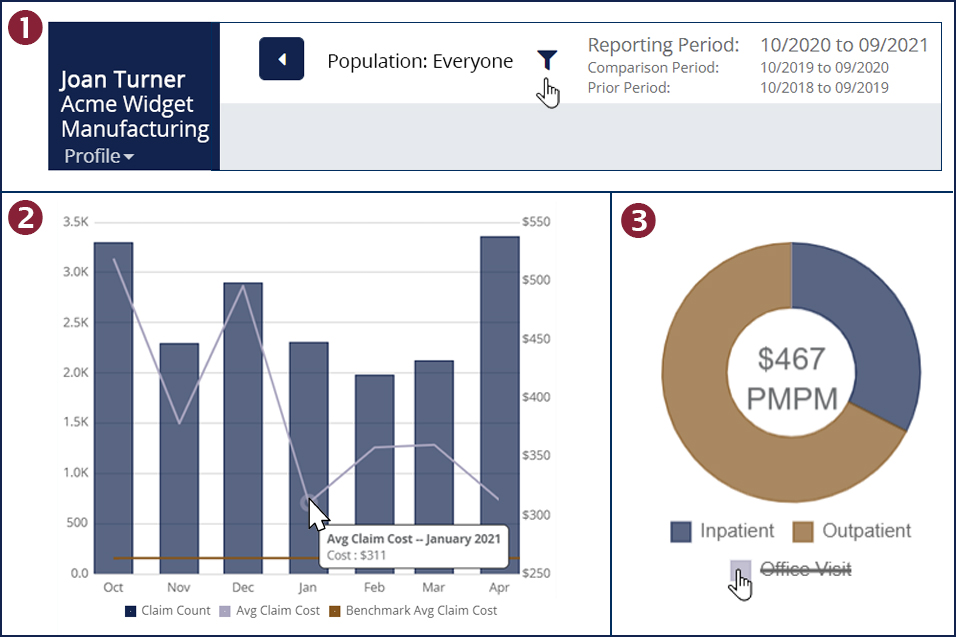
1) Edit filters at the top of the dashboard allow you to instantaneously modify charts and graphs by population, date ranges, and/or incurred or paid claims. You can also select benchmarks to compare your plan’s data against MedBen’s business block, national norms and/or specific industries.
2) On a chart or graph, when you hover over a bar, line or (donut chart) slice, you will instantly see relevant data for that period. Or hover over benchmarking data for additional comparative information.
3) If a chart or graph has a data legend, you can turn on or off specific data series. For instance, if you want to compare inpatient vs. outpatient use without factoring in office visits, just click the “Office Visit” series on the data legend and that information will disappear from the graph.
Taking advantage of MedBen Analytics’ interactive features enables you to better understand your plan’s activity – where your health care dollars are going and why. It’s actionable information that helps you make smart decisions.
Learn more about MedBen Analytics’ interactive capabilities by contact MedBen Marketing Analyst Morgan Dey at mdey@medben.com.